Source: Facebook Data For Good https://dataforgood.fb.com/ personal elaboration
With the data provided by Facebook – Data for Good’s program, we could analyze and describe some key mobility trends before and during COVID-19’s lockdown in Italy, one of the first and more affected countries.
We wanted to analyze mainly: how many people stayed home during lockdown; what happened between the announcement and the actual implementation of restriction measures (focusing on the discussed “exodus” of people from North to South, very stressed by media, if it happened and to what extent); and how population changed during lockdown, checking if people left cities and moved to marginal areas or urban belts.
This post outlines the source of data and summarizes the main findings.
A full working paper is available https://mpra.ub.uni-muenchen.de/100896/ for more detailed methodological description and a more in depth analysis of results.
Presence and mobility of the population during Covid-19 outbreak and lockdown in Italy.
MPRA working paper. https://mpra.ub.uni-muenchen.de/100896/
DATASET
The programme Facebook Data for Good has made numerous datasets available, also called Facebook Disaster datasets, for entire countries and/or for single regions/cities (described in Maas et al., 2019). For Italy the data is available on a national scale (“Italy Coronavirus Disease Prevention Map package”), with some more detailed focuses on single cities. For this paper we’ve focused on national scale data, using three of the available datasets:
- the Movement Range;
- the Movement between administrative regions – NUTS-3 provinces, in the case of Italy;
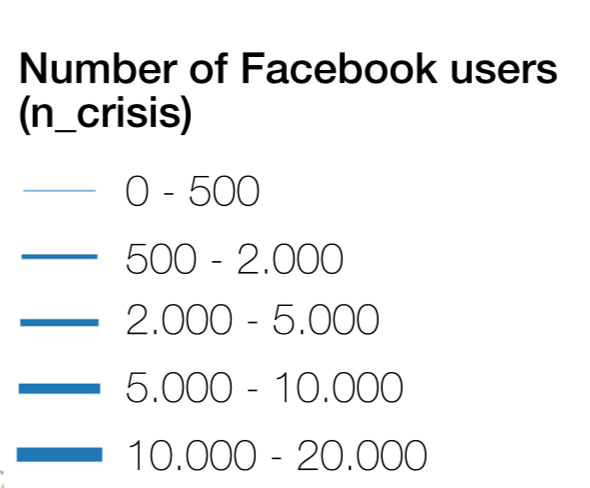
- the Facebook Population (Tile Level).
All datasets used contain spatial and temporal information based on the behaviour of Facebook users with active GPS and active Location History (in the case of Italy, approximately 5-6% of the population) with up-to-date information. The data is detected passively and is fully anonymised without individual information of the users. Individual information is aggregated spatially (either using tiles or administrative borders) and temporally (every eight hours: 02:00. ±4h, 10:00 ±4h, 18:00 ±4h).
THE COVID-19 OUTBREAK IN ITALY
Italy was the first European and Western country where the 2020 COVID-19 outbreak developed locally. The first confirmed cases were separately found in two areas of Northern Italy on February 21st. On February 22nd Italian government established a local lockdown in eleven municipalities involved. On March 4th all schools and universities in the country were closed. In Northern Italy, mobility already dropped since the 24th of February, with companies starting moving to smart working and people avoiding public transport. The country-scale lockdown, first in Europe, started on March 11th: all working places, except essential ones, were closed and people was requested to stay home except for food purchasing, health and work. The lockdown was announced on March 7th, when a draft of the decree circulated, talking about a possible closure of most of Northern Italy since 9th, but this measure was overpassed few days later by the full lockdown started. Due to this leak, according to media, many people left the cities of Northern Italy towards the South. Those who remained in their location couldn’t move anymore until the end of the measure (not even among neighbouring municipalities, and theoretically also within). At the start of lockdown, Italy had about 12.000 official cases and more than 800 deaths. This first phase of lockdown lasted until May 5th, when a progressive relaxing of closures started, including industry and most of retail. Movements between regions remain not allowed until June 3rd 2020.
THE LOCAL MOBILITY DECLINE
The available data allows both to measure the share of people staying “at home” and the average travel range on a provincial basis, before and during the crisis. The first indicator is proxied by the number of people that moved within a range of no more than 3 bing tiles; the second one by the number of tiles travelled. In both cases we plot the variation with respect to the baseline, which is 45 days before the event start (10 Jan – 23 Feb).
In the graph we observe how the implementation of early restrictions reduces the movement range in the North-West (Lombardy being epicentre region) and the North-East (Veneto being the second outbreak region) relative to the other macro-regions. The travel range has more drastically reduced during weekends and we can note the sharp decline in the mobility behaviour after the official announcement of the lockdown on the 9th of March, 2020 after which the behaviour of all regions become analogous and convergent to each other. On the same graph we can also observe the Share of people staying home metric, which is nearly a mirror of the former, but with less macro-regional differences.

Source:Beria, Lunkar (2020).
Presence and mobility of the population during Covid-19 outbreak and lockdown in Italy.
MPRA working paper. https://mpra.ub.uni-muenchen.de/100896/
THE BEGINNING OF THE LOCKDOWN: THE TALE OF AN EXODUS (THAT DID NOT HAPPEN)
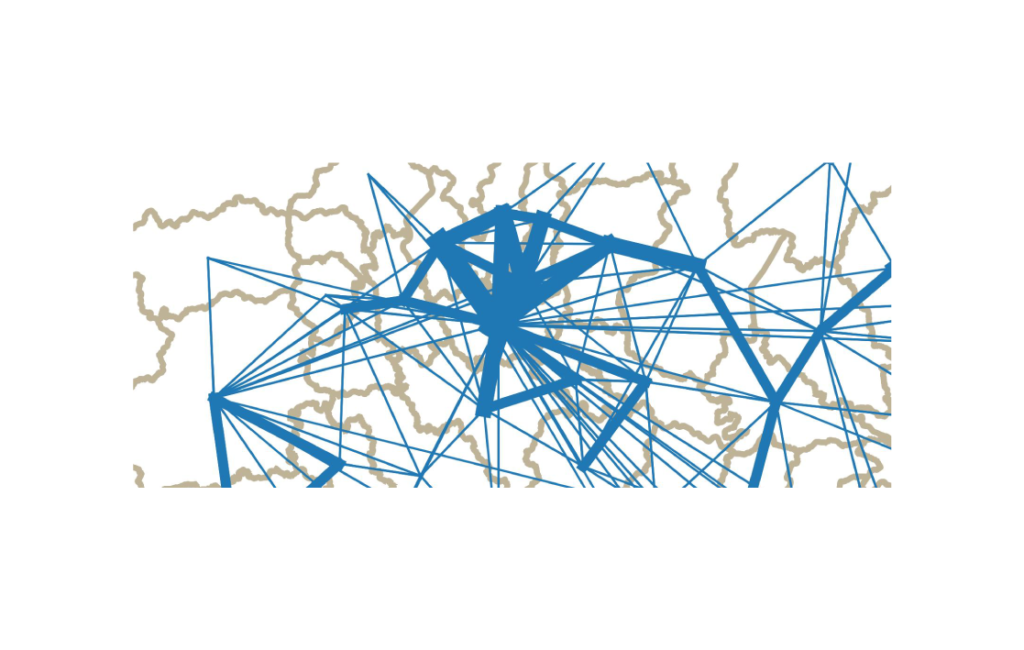
Long-distance mobility dropped not just during lockdown, but also before. Calculating the number of movements between Provinces (NUTS3) we obtained a trend similar to the previous one. Trips are about 90% of the baseline until the weekend of 7-8 March; then a steep decline starts in the following week, followed by seven weeks at 20%-40% of baseline (and nearly zero during weekends). In May the lockdown is relieved and the mobility, including the interprovincial one restarts (but regional borders remain closed). The map shows again the progressive end of movements across the country, which in the 2nd half of March looks disconnected. While initially we can recognize the usual patterns, with most of the flows within the North and along the coasts, plus some long-distance ones for example connecting Milan with Sicily, already on March 9th (before closure) they were substantially reduced. On March 24th the connections are basically absent, with the exception of some local trips among neighbouring provinces. Some connections between Rome and Sardinia and Sicily remain, probably also connected with cargo movements.

Presence and mobility of the population during Covid-19 outbreak and lockdown in Italy.
MPRA working paper. https://mpra.ub.uni-muenchen.de/100896/
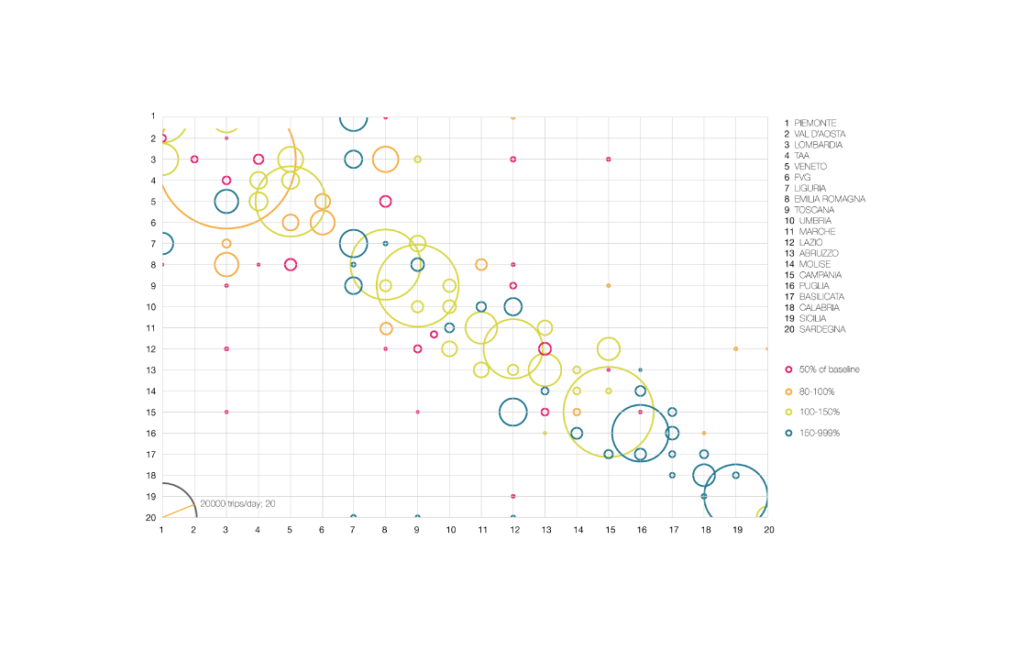
By means of these observations, we can also verify if there were anomalous trips between the North, the Centre and South, especially at lockdown’s announcement, as perceived by public opinion. The graph, for example, plots the outgoing trips from the entire Lombardy to the rest of the country. Not all destination regions are represented since there are no OD pairs with more than 10 trips (which is the threshold of the original data). Emilia-Romagna and Piedmont account for the largest flows, which is natural being at the same time large and neighbouring. Typically, during weekends these flows fall, as leisure connections are more limited than working ones. To the contrary, in direction of Liguria, Val d’Aosta and Trentino Alto Adige – despite on a different scale – we see some increase during weekend, in particular starting Friday 6th March and the following Saturday. The highest point of these flows is around 250 users, which should correspond to approx. 5000 people, per day per region. Therefore, in conclusion, we can affirm that, even from Lombardy, no significant pour of population from North to South or elsewhere can be observed, or is in the order of thousands of people.

Source:Beria, Lunkar (2020).
Presence and mobility of the population during Covid-19 outbreak and lockdown in Italy.
MPRA working paper. https://mpra.ub.uni-muenchen.de/100896/
AWAY FROM CITIES, AWAY FROM CONTAGION
After showing that no significant exodus occurred, it is more interesting to verify if cities have emptied and where population has moved: far away, in the periphery, towards second houses at the sea or countryside or abroad (tourists or expats/migrants and the corresponding return of Italians from abroad).
In this case we use the tile-level Facebook population data. At the national scale tiles measure approx. 4800 metres of edge and aggregate more basic tiles. The users present during crisis are compared with the baseline calculated on the presences during the 90 days prior to the event (which means including Christmas).
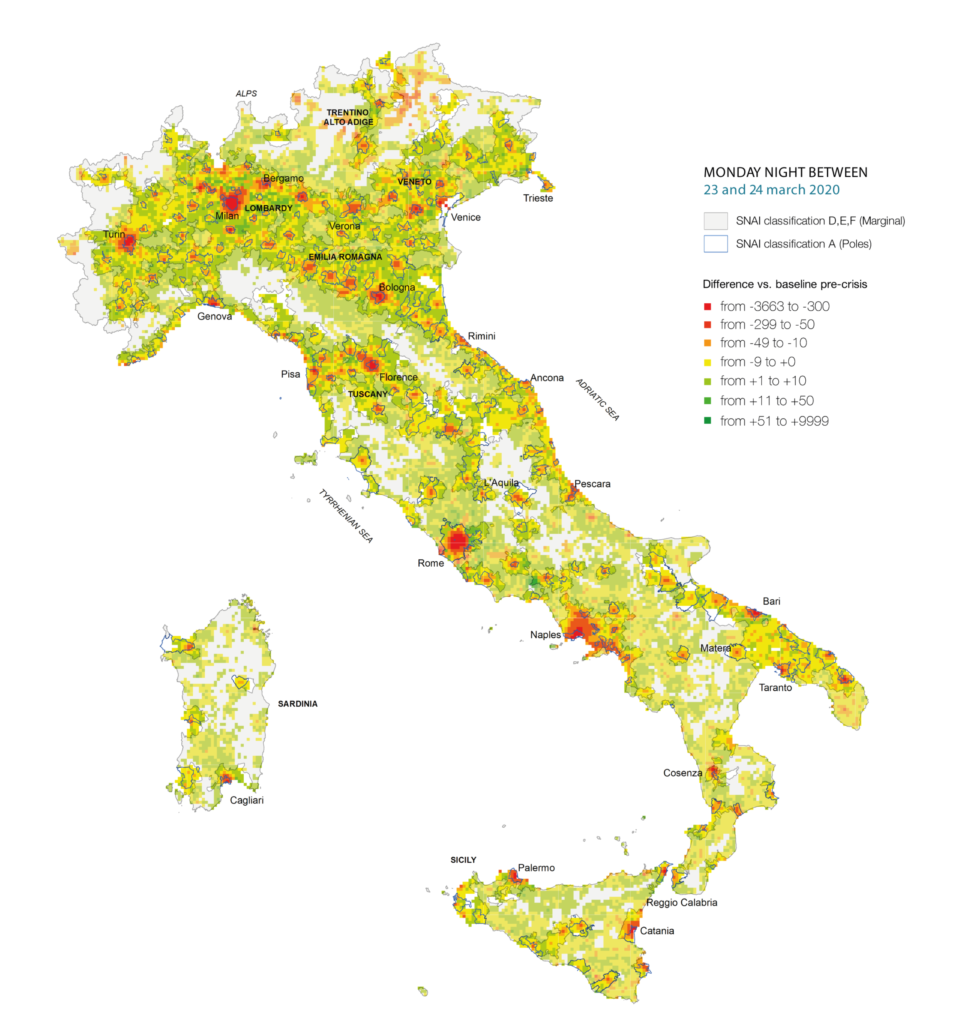
During the analysed period we observe a decline in population starting from March 10th (after the 1st day of lockdown) of about 4%, after 3-4 weeks, this figure rises again reaching a level similar to the baseline. Our interpretation is that initially foreigners, and especially tourists, left the country (we will go back on this later on), and later Italians abroad succeeded to re-enter. Consequently, the figures of the night of 27-28 April are the most interesting as represent a sort of picture freezing the position of Italians during lockdown.
With the exception of some Alpine areas, where the decline in population is due to the emptying of the ski resorts, the pattern is a clear escape from cities. Urban poles (usually provincial capitals and surroundings) lose 4,1% of their population) in the direction of Intermediate territories (that gain 1,8% of population), that could be described as the mid-density non- urban areas. With few exceptions, the largest population increase are in urban belts (around Milan, between the cities of Veneto, along the Adriatic coast, between Florence and Pisa, around Rome, Naples and Bari. In other words, the most inhabited part of Italian territory out of cities. The peripheral areas (classified D to F) gain population, but in the order of few thousands overall. This pattern means that the loss of population of cities must be attributed to the lack of commuters (daily or weekly) that now stay at home within cities commuting areas, and limitedly to the movement of people towards remote areas.

Presence and mobility of the population during Covid-19 outbreak and lockdown in Italy.
MPRA working paper. https://mpra.ub.uni-muenchen.de/100896/
MONDAY NIGHT BETWEEN 27 AND 28 APRIL 2020

Source:Beria, Lunkar (2020).
Presence and mobility of the population during Covid-19 outbreak and lockdown in Italy.
MPRA working paper. https://mpra.ub.uni-muenchen.de/100896/
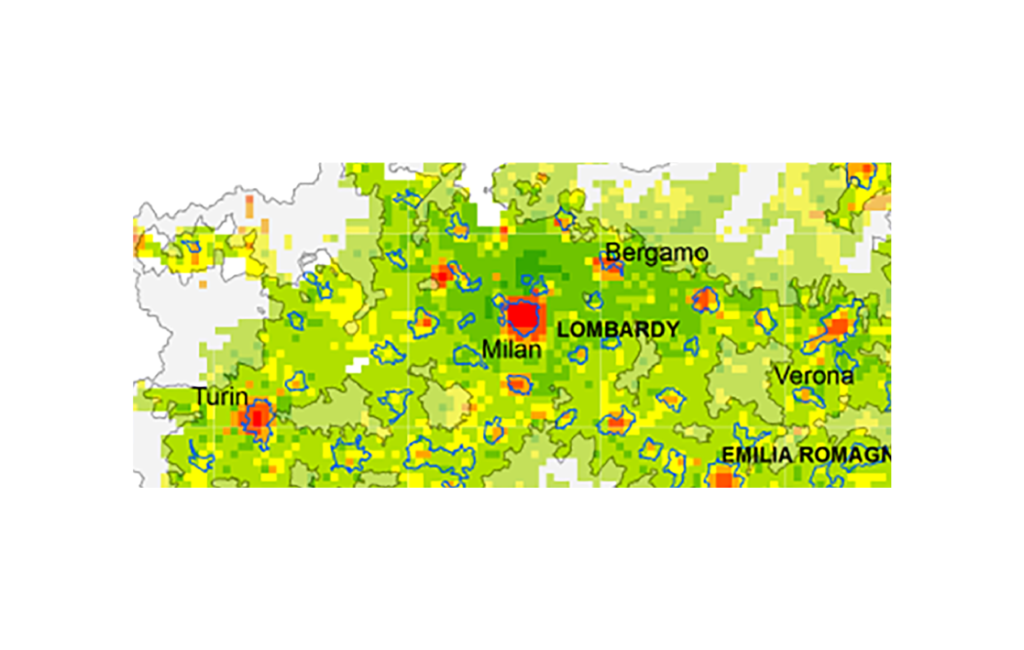
However there are some exceptions, which often belong to second-houses’ areas. For example, as mapped filtering tiles with an increase of more than 20 Facebook users, some well-known touristic sites appear, such as Ligurian coast between Genova and Santa Margherita, the Versilia area, part of the Tuscan coast, the “litorale romano” (beaches south of Rome), Ischia, Amalfi Coast and Lago Patria near Naples. The remaining tiles all belong to urban belts.
CONCLUSIONS
In this work we mainly tried to answer to three research questions. The first one was how much and to what extent people “stayed at home” before, during and at the opening of the lockdown. Despite the media narration of people ignoring the lockdown, data clearly show how the share of people moving and the range of movement fell dramatically to a nearly physiological level (supplies, health workers, necessary trips) since the beginning of March (the lockdown was declared on March 11th).
The second point was about people’s mobility just before the lockdown, especially from the northern provinces to central and southern Italy. This movement happened very marginally, with few thousands of people crossing the country to avoid remaining locked. Some non-local trips remained, but they are substantially confined to neighbouring provinces. Long-distance trips remain nearly always below the measurement thresholds.
The last aspect deals with the location of people during lockdown. The most visible phenomenon is the fall of population in largest cities, starting from the North, but soon occurred also elsewhere. People did not relocate (except few, of course) in marginal areas, but basically concentrated in the rest of urbanized areas. This fact has a twofold explanation: commuters and city users stopped moving into urban poles and out-of-home workers went back to the place of origin, which is often inside the region.
READ THE FULL WORKING PAPER ON: https://mpra.ub.uni-muenchen.de/100896/
Paolo Beria e Vardhman Lunkar